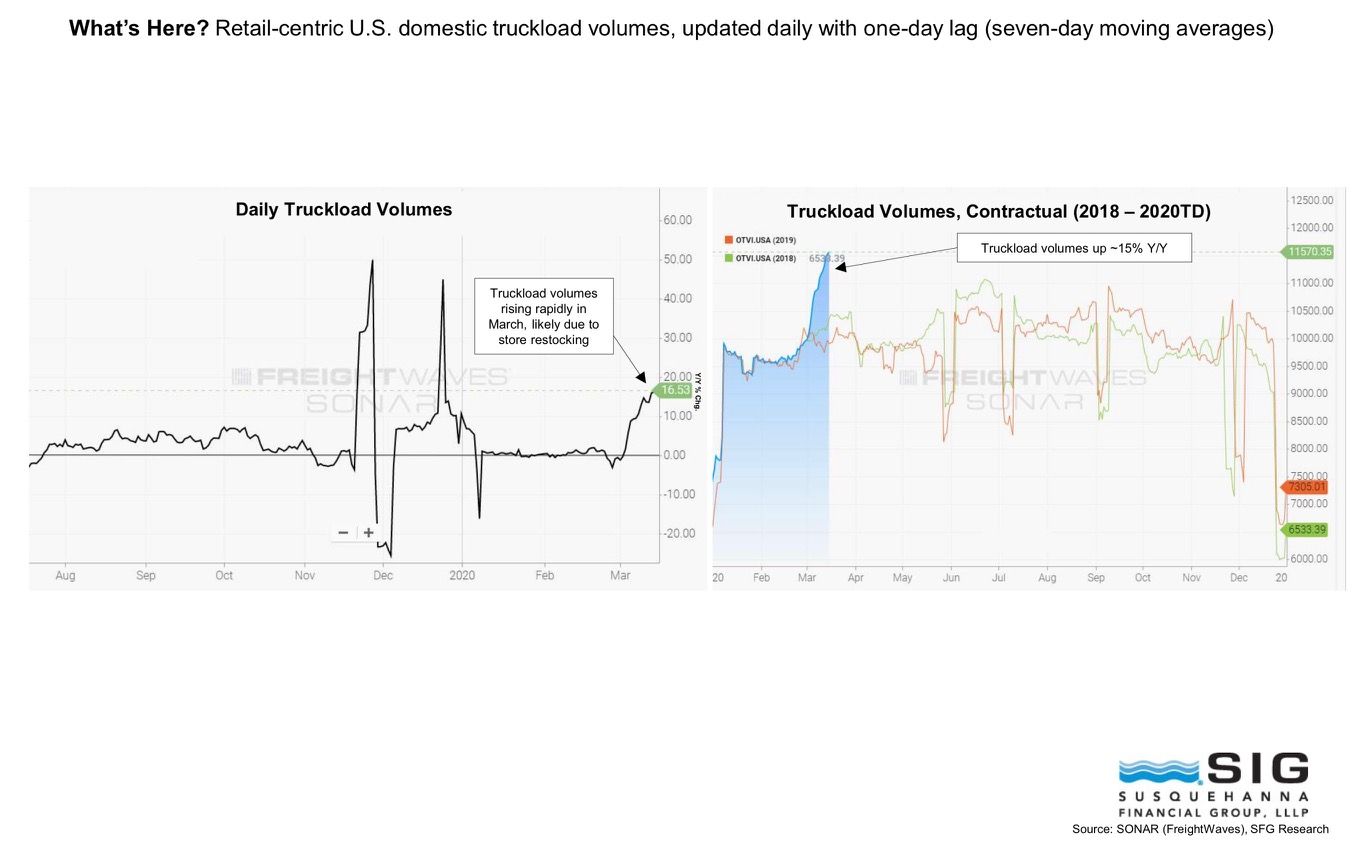
There is a noticeable surge in retail delivery between local warehouses and grocery stores. That’s clearly a trucking market. There is as of yet no perceived data that identifies a rail carload or a rail intermodal equivalent market service in this retail support area.
Intermodal data is relatively transparent given its integration with trucking and broker companies as intermodal sellers and buyers.
Meanwhile, the carload business is more of a black hole when it comes to current week market insight. There is a time delay. Eventually, data analytics and mathematics will pierce that veil.
It’s little things like these kinds of emerging graphics that make data more valuable as the new digital era ways to monitor the differences between the steel wheel and the rubber tire markets.
Strategic intel requires going deep into the library “stacks” to find the important footnotes that give us real signals.
What are your sources for insight these days?
Don’t rely just on me.
You need more sources then an old railway economist.
———————————-
This graph combines Multiple sources plus new statistical science from places like SONAR.
———————————-
Cheers!
Jim Blaze

